Engineering

R&D thru Product Development & Production

ARC typically follows a commercialization technology readiness process when determining the appropriate approach for project quotation and management. Numerous models exist, two of which are shown below.

The Typical Commercialization Chart is useful for straightforward projects with limited Phase 1 and 2 activities where there is much to be learned and revisions are more numerous. These are low Research and more Development projects. This said, ARC takes projects from Prototypes (TRL2) on through to Low Volume Production (10,000 – 30,000 annually) (TRL9).

The TRL model is better for more complex projects with extended research and prototyping activity. This model applies to SBIR/STTR projects from such government agencies as DoD, DOE, NASA, NIH and NIST as well as larger and more complex commercial projects.

 Typical Commercialization Phases Technology Readiness Level Definition (TRL)
   1 – Research to Proof of Concept TRL 1  Basic Research
 TRL 2  Applied Research
 TRL 3  Critical Function or Proof of Concept Established
   2 – Development/Prototype Verification TRL 4  Alpha Prototype Component Lab Testing
 TRL 5  Alpha Prototype. System Lab Testing
(DVT and Design Review)
 TRL 6  Beta Prototype System Lab Testing
(DVT and Design Review)
   3 – Pilot Production TRL 7 Pilot Production System Demonstrated
(DVT and Design Review)
   4- Production TRL 8 Pre-Production System Commercial Design
 TRL 9 Production System Proven and Ready for Full Commercial Deployment

Contract Engineering Solutions

Project Management

ARC uses MS Project as needed to track and manage the many details of a complex project. Shown right is a project Gantt Chart for a DOE Phase I SBIR which will be discussed further below.

DOE SBIR Micro Ion Spectrometer(MIS) Gantt Chart
Figure 1. DOE SBIR Micro Ion Spectrometer(MIS) Gantt Chart

Modeling Software

Magnetics, Heat Transfer, Convection and Electrostatics Modules are combined with Solidworks CAD to provide ARC customers with the design verification needed before launching a project.

Finite Element of a Thin Film Magnetic Head
Figure 2. Finite Element of a Thin Film Magnetic Head

Typical Projects

Magnetic Thermal Annealing (MTA) System (Commercial)

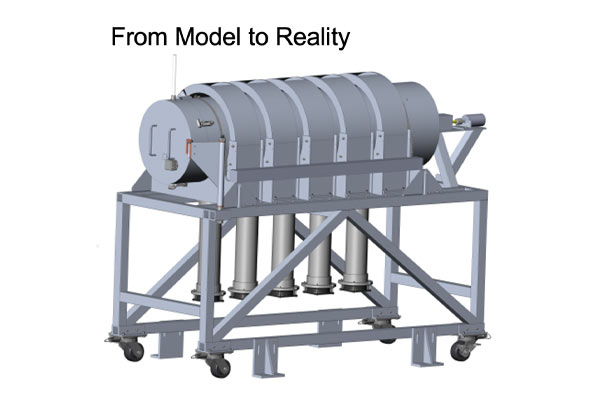
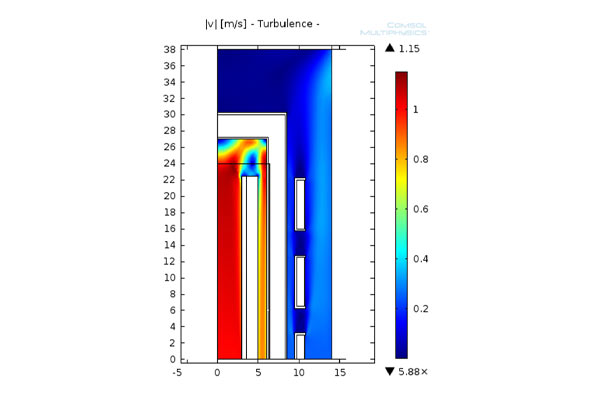
A customer provided ARC’s technical team with a Specification package. The team, in collaboration with the customer’s technical team expanded the written Specification and provided the 3D CAD solid model shown right in Figure 2 along with the Finite Element Analysis (FEA) model in order to fully understand the magnetic and thermal characteristics.

CAD Solid Model of the MTA from which the detailed individual part drawings were made
Figure 3. CAD Solid Model of the MTA from which the detailed individual part drawings were made
Thermal Model checking for temperature uniformity
Figure 4. Thermal Model checking for temperature uniformity
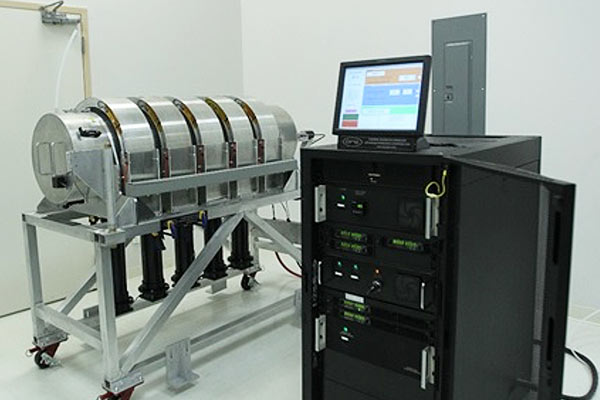
The MTAS is composed of the Magnetic Thermal Annealing Unit along with its computer driven System controller
Figure 5. The MTAS is composed of the Magnetic Thermal Annealing Unit along with its computer driven System controller

MRI Contrast Particle (NIST-NIH Phase I SBIR)

The objective of this SBIR was to develop a process for fabricating gold encapsulated, 1um dia, magnetic particles of various coercivities. This was expected to be a silicon wafer based process, 4” to start, and patterned using the mask in Figure 6 (right).

A Typical mask for 1um Particles with a 2um pitch, only a small area is shown.
Figure 6. A Typical mask for 1um Particles with a 2um pitch, only a small area is shown.
1um NiFe Particles encapsulated in gold (Au)
Figure 7. 1um NiFe Particles encapsulated in gold (Au)
1um NiFe/Au Particles released from the wafer in batches of 5 million particles
Figure 8. 1um NiFe/Au Particles released from the wafer in batches of 5 million particles

Figure 7 (above) shows typical particles after encapsulation still bound to the wafer. The wafer mask is segmented into discreet areas or mini strips of 5 sub areas of 1 million particles. The strips are diced and then passed through the release process. The free particles are shown in Figure 8 (above).

Micro Ion Spectrometer (MIS) (DOE Phase I SBIR)

The objective of this DOE Phase I SBIR was to further develop a semiconductor wafer based MEMS level, Ion Spectrometer by combining the Collimator with the Energy Analyzer in the same structure as shown in Figure 9 & 10 (right). A voltage in distributed across the curved channel walls in order to preselect the ion energies of interest. In Figure 11 (right) the cover/voltage distribution plate is attached. Further, a novel characteristic of this approach is that individual plates can be “stacked” or Hybridized to form Spectrometers for various ion densities from fusion to space. Shown in Figure 12 is stacked version of 5 plates with its cover plate. The objective for the Space Micro Ion Spectrometer is approximately a 1 cm cubed device composed of 25 plates.

Drawings and sketches may be submitted via our contact page. You will be contacted shortly to discuss your project.

1.25x 1.75 cm Single Plate Spectrometer with the Collimator and Energy Analyzer sections combined.
Figure 9. 1.25x 1.75 cm Single Plate Spectrometer with the Collimator and Energy Analyzer sections combined.
The single CEA plate with a cover-voltage distribution plate.
Figure 11. The single CEA plate with a cover-voltage distribution plate.
A magnified image of the Collimator and Energy Analyzer (CEA) section.
Figure 10. A magnified image of the Collimator and Energy Analyzer (CEA) section.
A stack of 5 plates for lower density plasmas
Figure 12. A stack of 5 plates for lower density plasmas